SIMS Trace Element Analysis
Introduction
A powerful feature of the SIMS technique is its intrinsically low detection limits. SIMS can determine the concentrations of most elements at abundances down to 10 ppb or lower. There are a number of factors which must be balanced against each other when designing a new analytical protocol. These factors include:
- Approximate concentration of the target element(s)
- Which elements are being analyzed for and which isobaric interferences may be present
- The number of elements that need to be analyzed for
- The amount of time to be spent on the analysis (generally a project funding issue)
- How precise the data need to be in order to answer the analytical question
- What spatial resolution is required
- Are suitable calibration standards available (matrix and concentration matched)
Secondary ion yields -- the fraction of the ions sputtered from the sample which are ejected from the samples as ions -- are a function both of the element being detected and the nature of the sample's crystallographic structure (or lack thereof for amorphous materials, such as glasses). Thus quantitative SIMS trace element analyses are critically dependent on having a well characterized standard which is closely matrix-matched to the sample material. Standards are used for calibrating the elemental yields during each analytical session: when analyzing the trace element composition of a silica-rich glass is it essential to use a silica-rich calibration standard, when analyzing a Fe-Ni alloy it is critical to use a Fe-Ni alloy calibration standard, etc. It is also advantageous to have similar concentrations of the target element(s) in both the calibration standard and the samples. Multiple standards with differing trace element abundances are valuable for assessing the presence of isobaric interferences. Finally, for those materials which possess significant solid solution variabilities in their major element contents (e.g., glasses or alloys) it is valuable to have multiple standards for mapping out how the secondary ion yields of a specific element vary with variations in major element composition.
SIMS trace element analyses measure the ratio of of the target element and a selected major element (usually 30Si in our lab). This must be done in both the standard and in the sample. It is then possible to calculate the absolute concentration of the target element in the sample using the following example for calculating the arsenic concentration in a silicate glass:

To determine the concentration of arsenic (green) in a sample of 'unknown' concentration it is necessary to know each of the concentrations or ion ratios shown in red. For samples which have heterogeneous major element compositions it is necessary to electron-probe the individual crystal domain prior to SIMS analysis. This approach includes the assumption that the isotopic composition of both the target element (in this case, arsenic is mono-isotopic) and the major element are the same in both the standard and the unknown; if this is not the case then a correction for isotopic variations must be introduced into this equation. A drawback of SIMS is the problem of isobaric interferences, which are frequently present in a secondary ion mass spectrum. Of particular significance is the formation of oxide complexes when measuring positive secondary ions. As an example, the m/e=56 mass station will detect ions for both (40Ca + 16O) and for 56Fe; thus the 56Fe isotope would be a poor selection when analyzing a calcium rich matrix. Two techniques exist for overcoming the spurious ions produced by such isobaric interferences: (1) energy filtering and (2) high mass resolution.
Energy Filtering
When primary ions interact with the surface of the sample, a fraction of the incoming kinetic energy is transferred to the secondary ions. These ions leave the sample's surface with an initial velocity (typically less than 100 electron-Volts) to which the ion probe's secondary extraction voltage applies an additional component (4500 eV in the case of the Cameca ims 4f). All species produce fewer high energy ions than low energy ones; however polyatomic 'cluster' ions (such as 40Ca + 160) are less efficient at generating high energy ions than are atomic species. If the machine is tuned to accept only those secondary ions which, for example, have between 75 to 125 eV of initial energy, it is possible to bias strongly the sampling in favor of the atomic ions that are ejected from the sample. The disadvantage of this approach is that high energy offsets result in large decreases in secondary ion signal intensities.
High Mass Resolution
In the case of (40Ca + 16O) and 56Fe neither of these species has a mass of exactly 56.0000. The true masses of these species are 55.93494 amu and 55.95750 amu, respectively. This small difference, ΔM, of 0.02256 amu can be exploited by the Cameca ims 4f such that the 56Fe ions will be passed through the mass spectrometer whereas the calcium+oxygen clusters will be rejected due to their lighter mass. The mass resolving power of a spectrometer is defined as the mass of the accepted ion ratioed to the total range in masses which the given machine conditions will permit. For our example, the minimum mass resolving power required would be:
M/ΔM = 55.95750 / 0.02256 = 2480
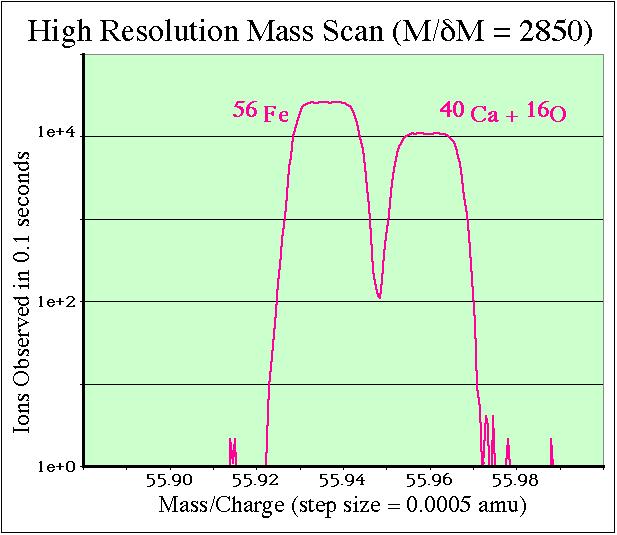
If the machine is tuned to a mass resolution of M/ΔM > 2500 it will be possible to eliminate the calcium-oxide interference from the iron signal, as illustrated below. The Cameca ims 4f can routinely operate at mass resolutions as high as M/ΔM = 5000.

By imaging the ions passing through the entrance and exit slits of the Cameca, it is possible to graphically show the effects of tuning the spectrometer to high mass resolution. Observing the ion count rates as the magnet field intensity is slowly swept over the mass 56 peak clearly shows that calcium+oxygen interference is completely resolved from the 56Fe signal.
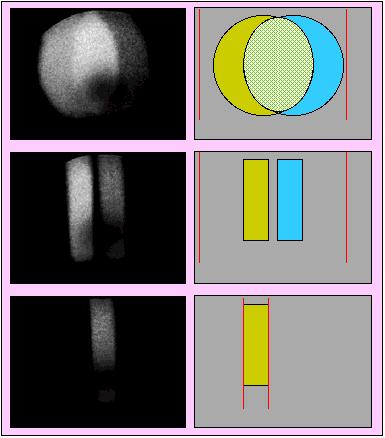
Demonstration of tuning the Cameca ims 4f for high mass resolution conditions
Left Hand Side: analog 'slit' ion images collected at mass/charge = 56. Right Hand Side: Cartoons explaining the adjacent ion images. In the cartoons green represents the 56Fe ions whereas blue represents the calcium-oxide signal.

Top frame shows the system tuned for low mass resolution of M/ΔM = 300; the circular shape is generated by a 750 micron contrast aperture located at the mass spectrometer's entrance slit.
Middle frame shows the condition where the entrance slit has been partially closed which eliminates the overlap of the two ion species.
Bottom frame shows where the mass spectrometer's exit slit (vertical lines in cartoon) has been partially shut so as to allow only the Fe ions to pass.