SIMS Basics
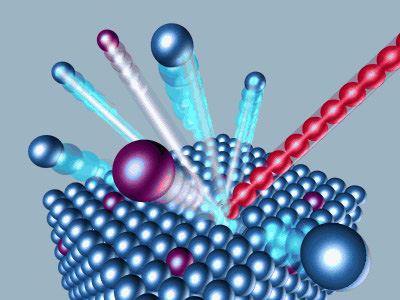
Secondary Ion Mass Spectrometry (SIMS) is a highly specialized analytical tool which combines high spatial resolution and high sensitivity. This technique uses a highly focused ion beam (generally oxygen or cesium ions are used for inorganic samples) which 'sputters' material from a selected domain on a sample surface. The 'secondary ions' which are ejected from this sample are passed through a mass spectrometer which separates the ions according to their mass/charge ratio, in effect providing a chemical analysis of a very small sampling volume.
For trace element analyses SIMS typically delivers ppb-level limits of detection on sampling volumes generally <10-7 mm3. When used as a tool for depth profiling, SIMS can provide <1016 atoms/cm3 sensitivity at a depth resolution of better than 10 nm. Cameca ims-series instruments also provide the capability to operate in 'ion microscope' mode, providing elemental mapping capability at the ppm level at ~3 µm spatial resolution.
Usage Rates
We assess hourly charges for SIMS lab users. Government/university users are charged $50 per hour, and non-government/university and commercial users are charged $100 per hour.
Geometry and Operation of Cameca ims-series SIMS
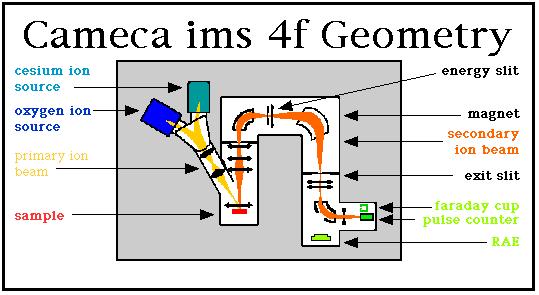
This diagram shows a schematic layout of the Cameca ims 4f. Our machine possesses two ion sources for the generation of the primary ion beam: (1) a 'hollow cathode duoplasmatron' for generating an oxygen ion beam, shown in dark blue, and (2) a cesium microbeam source, shown in turquoise. Only one of these sources is operated at a given time. In general, an O- primary beam is used when samples are being analyzed for metals and transition metals, whereas a Cs+ ion beam is employed for the analysis of non-metal species, as summarized in the following image of the periodic table.

The primary ions are subjected to an accelerating potential and the resulting ion beam is transferred, via three sets of ion lenses, to the sample surface. These ion lenses have two functions: they project the primary ion beam onto a small area of the sample (typically ~20 µm in diameter) and they are used to adjust the primary beam's total current (typically between 1 nA and 100 nA). When measuring depth profiles or when mapping the distribution of a selected isotope the primary beam is rastered at 20 kHz over a square area which can be adjusted from 0 to 500 µm in size.
Trace Element Analysis
Bombardment with the focused primary beam generates a crater on the sample's surface. A small fraction of the material sputtered from the crater is ionized, and these secondary ions are accelerated through a 4.5 kV potential. The resulting secondary ion beam is passed trough a sector magnet for mass separation; signal detection uses either an electron multiplier operated in ion counting mode or, for intense secondary ion signals, a Faraday Cup is used to directly measure the secondary beam current. By repeatedly stepping the magnet through a sequence of mass stations it is possible to determine the concentration of each of the selected elements.
In order to convert the observed secondary ion signals into the absolute concentration values for the sample it is necessary to calibrate the secondary ion yield for the given analytical session. In general, all analytical sessions should both begin and end with and analysis of a calibration standard. Ion yields -- the efficiency with which the sputtering process produces ions -- is a function of both element and the matrix which are being studied. We routinely compare analyte element counts with those for 30Si to calibrate secondary yields, as illustrated in the figures below.
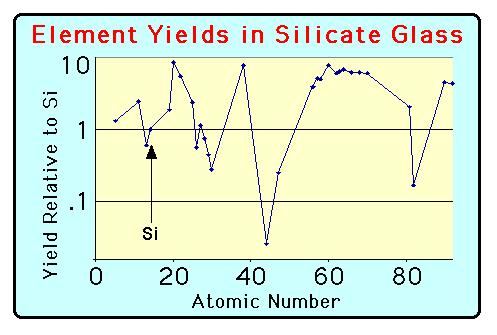
This figure shows the variability in the secondary ion yields for 30 elements as measured on a suite of NIST silicate glass standards. These data have been normalized to the yield for silicon. Data for positive secondary ions were collected with a 100 Volt energy offset. Note how the periodic variations in ion yields reflect the rows of the table of elements. For more details, please see the section on trace elemental analysis.
Mass Spectra
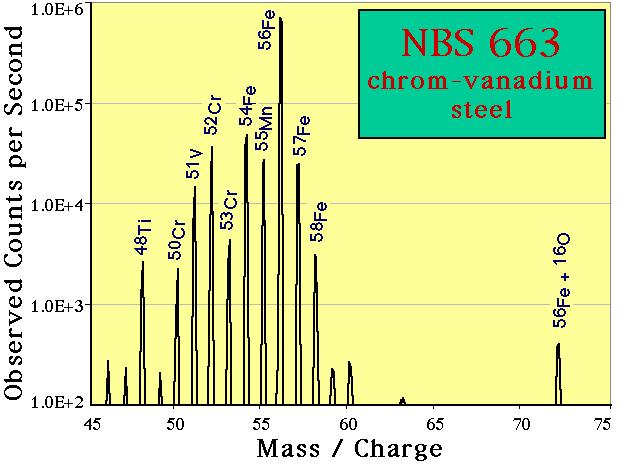
By sweeping the power applied to the magnet, it is possible to scan a selected part of the periodic table. This capability is a very useful tool for identifying contamination is high-purity synthetic materials. Both the mass range and the magnet dwell time per mass station can be adjusted. The mass spectrum shown above was measured with a 1 nA 16O- primary beam using a 1 second dwell time per station, 10 stations per AMU, 100 V offset applied to our nominal 4.5 kV secondary accelerating voltage. NOTE: these data are plotted on a logarithmic intensity scale. Titanium is clearly detected as a constituent of this material. The use of the energy offset suppresses the detection of polyatomic secondary ions; nonetheless the presence of an iron oxide peak at mass m/e=72 (56Fe + 16O) is seen.
Depth Profiling
A very important aspects of SIMS technology is its capacity to provided information on the distribution of trace elements as a function of depth. This feature is of particular importance in the fields of semiconductor research and materials design. The ability to detect concentrations of many elements at concentration levels <1017 atoms/cm3 while providing depth resolution of <5 nm remains largely unchallenged by other analytical techniques. SIMS depth profiling can provide important information for ion implant dosimetry, for thermal or chemical diffusion studies and for research projects evaluating chemical modification at thin film interfaces. The absolute abundance of a target element as a function of depth is generally calibrated by running an implant standard of identical matrix and of know total implant dosage.
Imaging
The Cameca ims-series instruments are designed to project a real image of the sample's surface onto a 2-dimensional channel plate. At high ion count rates elemental distributions are detected by a phosphorescent screen detected by a video camera. This valuable feature makes possible the rapid imaging of variations in major element distributions, and is extremely valuable for tuning the secondary ion optics of the machine.
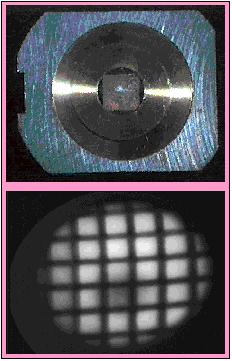
Top Image: Copper/aluminum grid with 25 µm Cu grid element spacing; the grid is masking an aluminum backing. The grid is held in a brass mounting ring which is placed in a standard 1" diameter Cameca sample holder.
Bottom Image: 27Al+ image of Cu/Al grid as projected onto channel plate/phosphorescent screen. This images was recorded by 30 Hz analog camera; field of view = 150 µm, spatial resolution = 3 µm, count rate = 4x10⁵ ions/second. In this view the Al backing appears bright, whereas the regions masked by the Cu grid wires are dark. The round shadow at the bottom-center of the image is an artifact produced by loss of sensitivity in this region of the channel plate/phosphorescent detector.
At low count rates, generally reflecting low elemental abundances in the sample, analog will not work. Fortunately, our instrument possesses a Resistive Anode Encoder (RAE) upgrade which replaces the phosphorescent screen with a solid state pulse counting detector. This ability to digitally record the spatial distribution of the ion signal, along with the capacity to integrate this signal for periods up to 30 minutes, permits the mapping of elemental distributions down into the ppm concentration level.
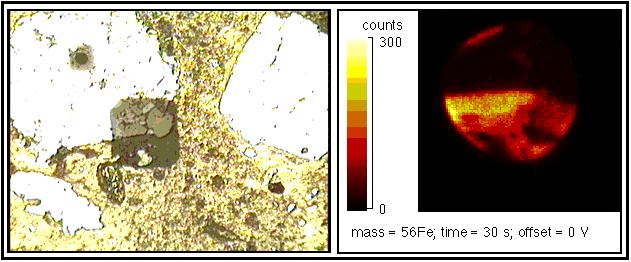
Below is an example of RAE data from an anthropology study of pottery fragments: The image on left is a visible light micrograph of the polished surface of a potsherd. The field of view across this view is 1 mm. The bright areas are 'non-plastic' components which are surrounded by the yellowish colored clay matrix. The black square in the middle of the field of view is a 250 x 250 µm raster patch from which a broad range of RAE images were collected. Also visible is a black spot, to the upper left of the image and in the center of one of the clasts from which isotopic data have been collected. The image on the right is a map of the distribution of 56Fe collected from the middle 150 µm region of the raster patch at the center of the visible light image. The integration time for this digital image was 30 seconds. Note the strong correlation between the high Fe contents and the clay matrix.
